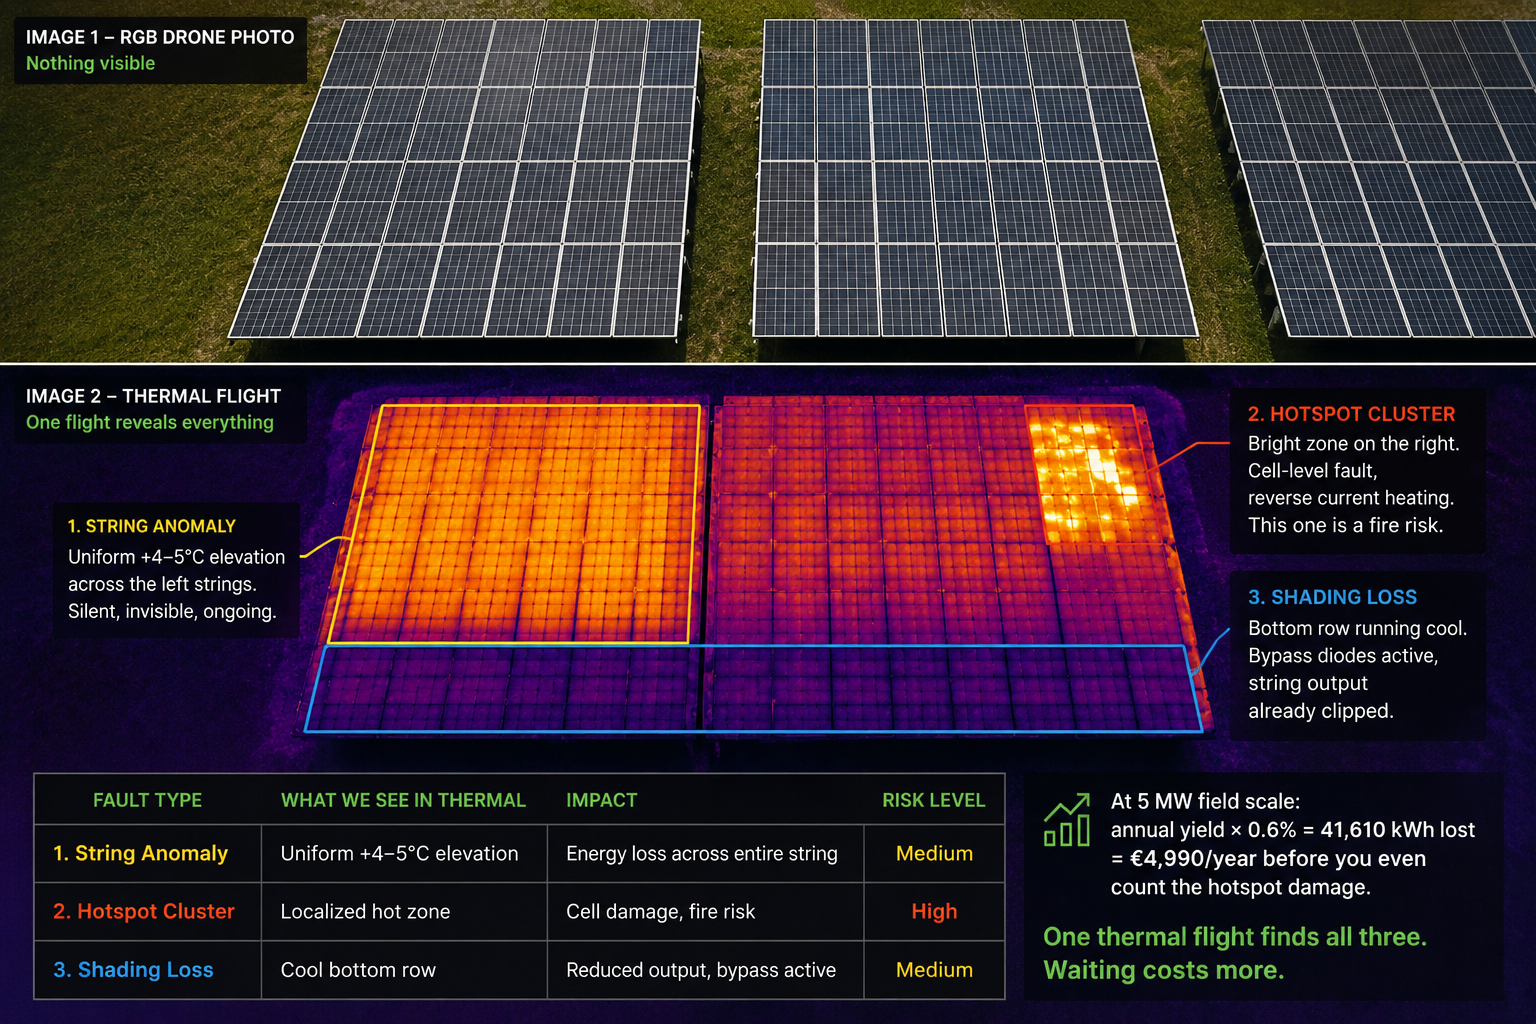
Two images. Same solar table. Same October morning in Latvia.

Image 1 — RGB drone photo: four clean tables, green grass, nothing unusual.
Image 2 — one thermal flight reveals three separate faults on the same table:
Three fault types. One table. Zero warning signs in the RGB image.
At 5 MW field scale: annual yield × 0.6% = 41,610 kWh lost — €4,990/year before you even count the hotspot damage.
One thermal flight finds all three. Waiting costs more.
What is your inspection interval?
we’re happy to talk it through.